Circling Back: Gloom, Dots, and GDP
Today's post dives into some questions and comments on my recent posts on sentiment, Fed forecasts, and revisions to the national accounts.
Here’s how today’s post works: I start with a link to my original piece and then go through one or two questions I received. It’s wide ranging from social media and sentiment to the new data revisions to real interest rates. Hope you enjoy the format!
Why can't we shake the gloom? It's more than inflation or higher prices.
Today’s post expands on my Bloomberg opinion piece about the unusually large degree of pessimism about the economy. After exploring several possibilities like inflation, partisanship, and negative news bias, I argue it’s Covid and its aftermath. Given the feedback to my piece, I will come back to my arguments about why inflation can…
Circling back to this post is an opportunity to explore other hypotheses about why people are more gloomy than the current circumstances would have normally predicted. Because businesses, policymakers, and investors use sentiment to assess where the economy is headed, we must understand this new gap.
What about the influence of social media on perceptions?
This question continues to chip away at why people are unusually downbeat. It’s a reasonable question to ask. Social media is relatively new. Plus, some research suggests that social media use is associated with depression. And that’s only one example of how social media may have darkened views about the economy and de-emphasized good news, such as historically low unemployment.
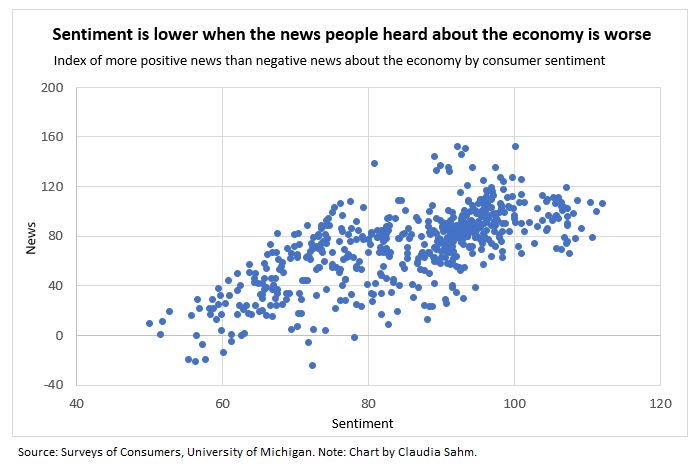
The survey I used in my original post asks about news about the economy, regardless of source, not social media alone. There is a clear relationship between the two: the more positive the news heard about the economy on net, the higher the consumer sentiment. (Correlation is 0.7.)
However, correlation does not tell us if news influences sentiment—as most economic models with expectations assume—or if sentiment influences the news that people hear. In the second case, reporting follows people’s views about the economy, or people seek out news that confirms their views about the economy. Alternatively, something else could drive them both.
That’s the question that Piet J.H. Daas and Marco J.H. Puts, economists at Statistics Netherland, attempted to answer in 2014 using public Dutch Facebook and Twitter posts and a consumer sentiment survey in the Netherlands—similar to the Michigan Survey. They document a highly positive correlation (of 0.9) between the two and then ask which causes which.
To do so, they used a statistical approach called Granger causality. It compares the timing of changes in the two variables, and if one variable changes before the other, then the argument is that the first causes the second. They argue that consumer sentiment changes about a week before social media sentiment and that there appears to be a common “mood” component. So, consumer sentiment and social media are both capturing a national mood. Applying their findings, sentiment from either source could help predict behavior as they mainly measure the same mood phenomena. However, this also implies that the tie to economic data is less tight. That makes it possible for a disconnect to arise like a “vibecession.”
Fun fact: Tweets in the Netherlands have a positive bias. A reminder that we should be cautious in extrapolating results from the Netherlands to the United States.
Are there partisan differences in expectations for inflation and unemployment?
But “mood” or “vibes” is not a satisfying answer. What is the source of the darkened mood? I argued in my original post that the pandemic and the dislocation caused was the reason. The Great Depression weighed on that generation their entire lives.
Partisan affiliation is another possibility. Seeing huge and growing differences between Democrats and Republicans in consumer sentiment is unnerving to those who might use the Michigan Survey as a proxy for individual expectations that influence behavior. But the survey questions in the sentiment calculations are broad; here’s the one long-term on expectations for the economy:
"Looking ahead, which would you say is more likely--that in the country as a whole we'll have continuous good times during the next five years or so, or that we will have periods of widespread unemployment or depression, or what?"
It’s not hard to see how that question could pick up more than views about the economy. The other questions have more explicit links to economic concepts, but all are pretty general. So, the question above is whether the partisan bias disappears if the respondents are asked about specific economic phenomena.
Richard Curtin, former director of the Michigan Survey, examined the partisanship in the sentiment in his note in January 2022, “The Partisan Economy.” The answer is generally yes, that partisanship holds up with some exceptions.
For example, expectations about the unemployment rate in the next year show a partisan bias: Democrats are more optimistic about the labor market (blue bars) during a Democratic Administration than under a Republican Administration and vice versa. The bias jumped under Trump and remained elevated under Biden, though the sign flipped. Moreover, the partisan bias in the labor market expectations is similar in magnitude to the bias in overall expectations—which is in the main index—for the economy one year ahead.
Partisanship in near-term inflation expectations (green bars) also exists, but these data end in December 2021 when the inflation rate peaked at 5%. Also, since the inflation expectations are point estimates and inflation varies over time, it’s challenging to compare these responses to the ones about labor market or overall expectations. We can see that Democrats expect less inflation when Democrats are in the White House, such as now, and more when Republicans are in the White House.
Even with a partisanship bias, these measures of expectations likely tell us something about economics. The two parties pursue very different economic policies, and voters have different views on the effectiveness of economic policies. It’s a different question about how much that shapes an individual’s economic decisions. Also, remember that since the economy is pretty evenly split, this particular bias should largely average out. It is a broader message on how economic variables we typically use to explain sentiment do not reflect all the factors in respondents’ answers. Use and interpret with care.
The SEP Strikes Back
“Don’t underestimate the Force.” ~ Darth Vader Forward guidance is the Force of monetary policy, and the Summary of Economic Projections (SEP) is one of its primary tools. Forward guidance is an approach the Fed uses to influence borrowing costs for firms and households now by signaling what it will likely do in the future.
Borrowing costs have shot up since the FOMC meeting. Exactly how much the Fed and the SEP contributed is unclear, but they are in the mix. My post on the power of the SEP held up well. However, there are important interactions with other economic developments like solid labor market data and a focus on government debt.
Thank you for highlighting the important difference between real and nominal rates.
It could be an essential distinction next year. Here is the relevant section in my original post that explains why real rates (nominal rates minus expected inflation) are important. The chart shows rates calculated from median forecasts SEP.
Fed officials have differing views about whether holding the nominal federal funds rate steady as inflation comes down will imply more tightening. Basically, they disagree on what real fed funds rates is. New York Fed President John Williams says the Fed will need to cut to keep the real rate constant as core inflation comes down. In contrast, the “higher for longer” consensus on the FOMC appears to be that nominal and real rates track together, since long-term inflation expectations are anchored.
When core inflation and measures of inflation expectations are stable, as was the case for many years before the pandemic, how to measure real rates was not an issue for the Fed. But now inflation is falling and expectations are stable. If Williams is correct, the nominal rate should come down with inflation next year. Otherwise, the Fed would be tightening more than they say they want to and risk doing too much.
It's what you thought you knew but didn't that breaks your heart: GDP revision edition
Today’s post is a wonky one but important one. A data-driven Fed requires data, and those don’t come down from heaven. I talk here about the data improvements coming this week. What the Fed does or doesn’t do next hinges on data; in fact, the Fed always calls itself “data-driven.” Fed Chair Powell underscored that multiple times at l…
The recent revisions to the national accounts, which include GDP, are a good opportunity to remember that the initial estimates we get, whether GDP, inflation, or employment, are precisely that: initial estimates. They are subject to revision and do not promise to be “the truth.” A $24 trillion economy is too complex to measure perfectly, though statistical agencies give it their best. Those using economic data must treat the data carefully.
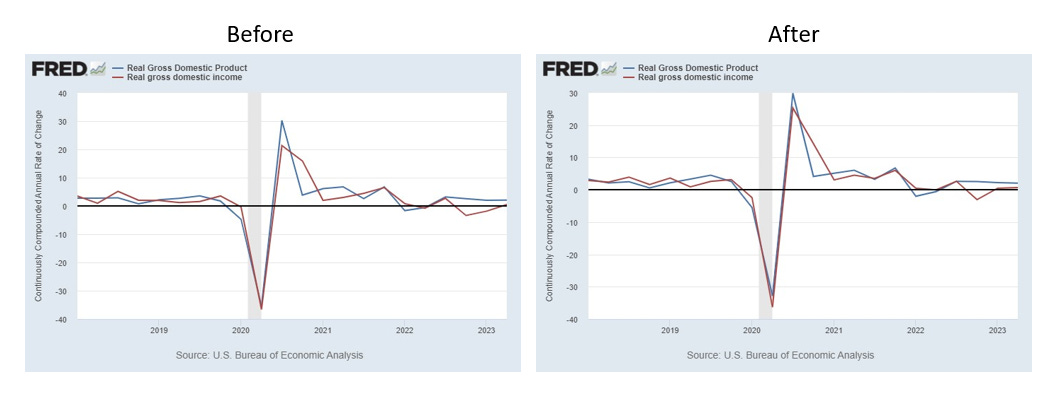
Looks like the revisions came in the other way! GDI was revised up to match GDP. Just goes to show how hard it is to calibrate these takes! 2023 Q1 GDI growth revised from -1.8% to 0.5%...
Sometimes, being wrong is good. To the extent that the gap between GDP and Gross Domestic Income (GDI) closed with the BEA’s comprehensive revision, it was GDI revising up. That’s the best outcome. Both are measures of economic activity, and the updates tell us that the strength in GDP (blue)—which was initially stronger than GDI (red)—was a more accurate read on the economy. In the grand scheme, the revisions were not that big, and revisions will keep coming for years.
A different way to see these revisions is to look at the levels after (solid lines) and before (dash lines). The recovery in GDI (red) had lagged behind GDP (blue), but these latest revisions made significant progress in closing the gap. It’s sizeable most recently, but the upward revisions to GDI were clear even there. (By the way, ALFRED is an excellent tool for seeing how estimates change over time.)
The research I shared in the original post argues that, on average, GDP revises toward GDI. And this time is not average. Add it to the list. Big picture: the economy is solid.
Another interesting revision was core inflation. In general, core inflation (monthly at an annual rate) after the revisions (red line) last year came in higher than the estimates before the revisions (blue line). The disinflation in the monthlies this year was faster than previously estimated. The level of prices is now about 1/2 percentage point higher than before. It’s not a story changer, but given the focus on inflation, even a tenth higher or lower would have gotten attention. Now? Not so much.
In closing.
To recap:
People’s views about the economy are tied to more than the ‘hard’ economic data. One’s identity, such as one’s politics, and the collective mood play a role, too.
Monetary policy is easier in theory than in practice. Even something as fundamental as what’s the real federal funds rate is debatable.
Our understanding of what’s happening in the economy takes time. It’s good to use data in decision-making; it’s not good to only use data, as it could change.
I hope you enjoyed my ‘circling back’ post today. I greatly appreciate the comments and questions. Your feedback on the format is welcome. At its best, writing starts a conversation. Today is my attempt to keep some conversations going.


I've said it before and I'll say it again, the US economy is a very complicated maze. There's good featuring the labor market and wages and also not so good with inflation still a pain in the neck. Agreed that the sentiment will always be a partisan issue but It's also important to present the facts about the state of the economy and not some wild propaganda.
As an insider could you explain why the Fed would publicize what officials speculate that they themselves will do in the future.? After all, we do don't know what data they are expecting to see that would lead them to decide on changing or not changing a policy instrument? It could seem contradictory to being data driven.
Do you feel any frustration that the Treasury is not providing more expectations-reveling market instruments. In addition to 1, 2, an 3 year TIPS, it could issue a issue a Trillionth security with maturity linked to TIPS.